
The Data Book just got smarter. With issue-tracker heatmaps, custom dashboards, and Smart Issues (AI-powered beta), Shape raises the bar on project analytics and issue management.
Data Book Enhancements
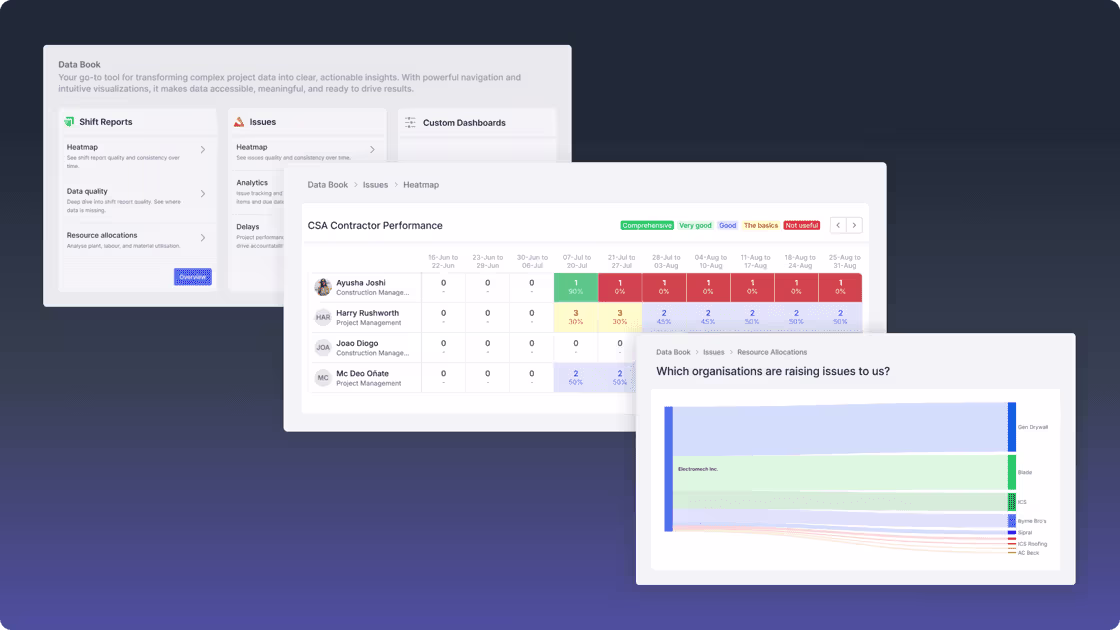
Issue Tracker Heatmap
Similar to our Shift Report heatmap, you can now visualise issue quality across your team. The new Issue Tracker heatmap shows:
- Who’s creating issues and how many they have open
- Issue quality scores based on evidence and completeness
- How issues degrade over time when not updated (staleness indicators)
- Weekly trends to identify patterns and improvement areas
Custom Dashboards
We’ve added a new Custom Dashboards section to the Data Book, allowing us to create bespoke analytics tailored to your team’s specific needs. These dashboards provide specialised insights beyond our standard offerings, helping you track exactly what matters most for your project.
Talk to us
Ready to turn these advanced analytics into your competitive advantage? Speak to our team at Shape to view a live demonstration of the enhanced Data Book, see how the heatmap visualisations and custom dashboards can be tailored to your project, and learn how you can roll these improvements out with minimal disruption.


Frequently Asked Questions
HIGHLIGHTED CONTENT

SUBSCRIBE TO OUR NEWSLETTER
Get the future of construction control straight into your inbox.
%20copy.avif)
%20copy.avif)


