Warning signs often get missed until they've already hit the schedule. Data Book shows you where to look and what needs attention now.
Uncover the trends affecting your producction
Surface hidden patterns in your data, from resource gaps to recurring blockers, so you know exactly where to intervene.
WHY IT WORKS
Staffing gaps and inefficiencies become visible through resource tracking
Problem areas emerge with issues mapped by location and contractor
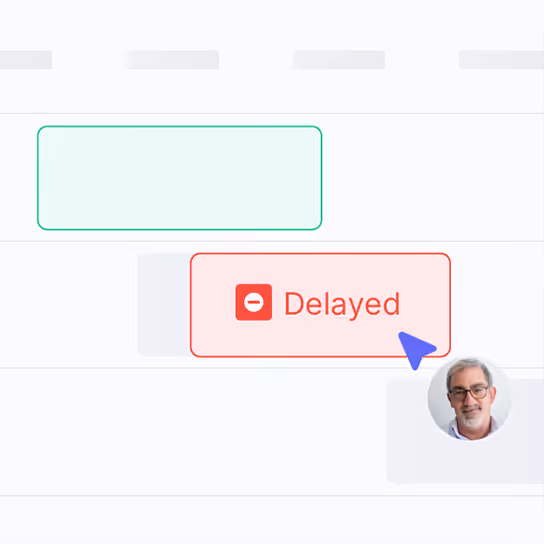
Active delays and emerging risks are flagged with clear accountability

Know if your field records are reliable
See where reporting is falling short across your team so you can course-correct before it affects your evidence trail.
WHY IT WORKS
Each record gets scored for completeness, from daily reports to issues
Heatmaps show record-keeping compliance by team member at a glance
Staleness indicators flag when issues haven't been updated and need attention

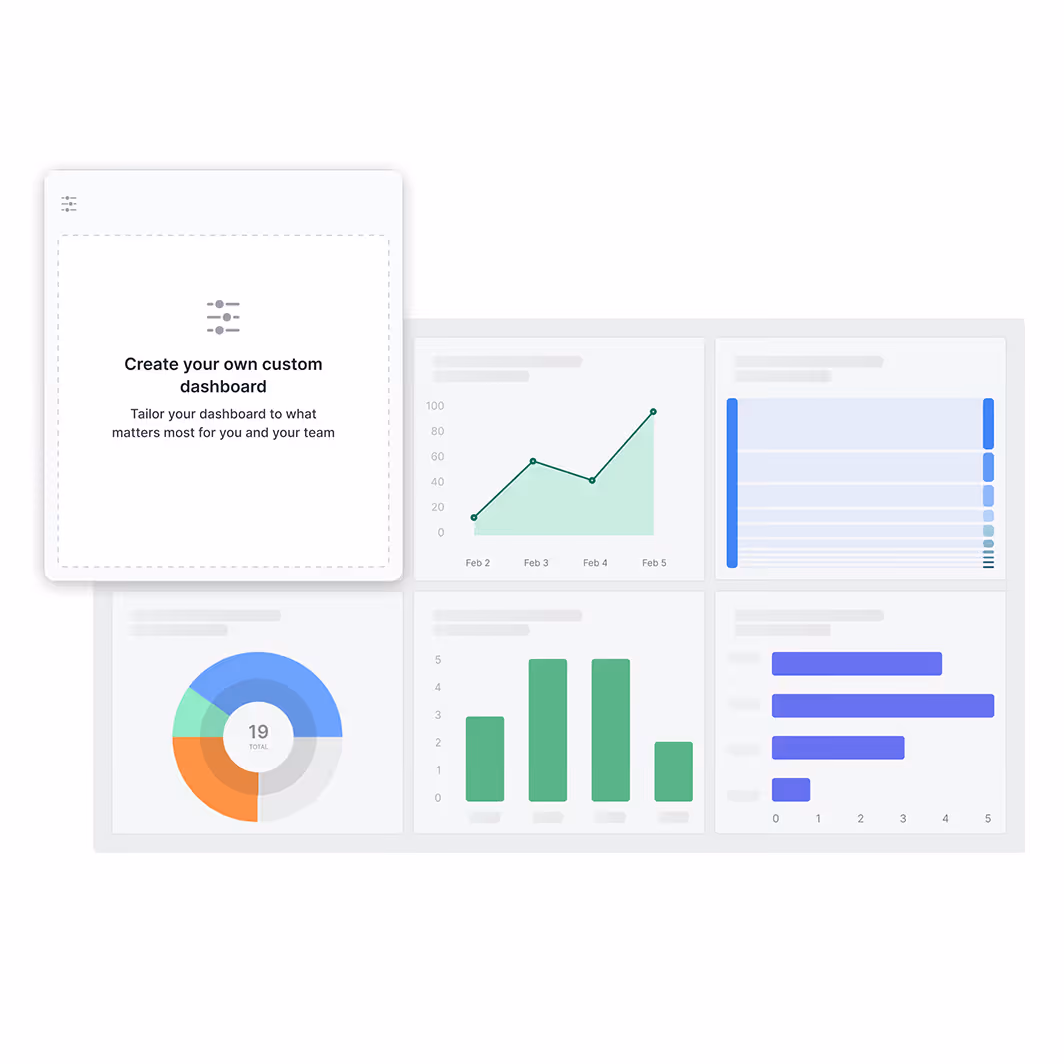
Track exactly what matters for your project
Get specialized dashboards that are tailored to your management needs, going beyond standard metrics to monitor what drives your project's success.
WHY IT WORKS
Track KPIs unique to your project type, sector, or delivery method
Combine data across multiple sources for complete visibility
Get presentation-ready views for different stakeholders

Explore other tools in Shape
Frequently Asked Questions
Shape Data Book is construction project analytics tool that turns daily reports, issues, and weekly plans into production performance dashboards. It scores record completeness across the team, highlights problem areas by location and contractor, and surfaces resource gaps and recurring blockers, so project managers know exactly where to intervene before risks hit the schedule or the contract.
Every Shift Manager report, Issue Tracker entry, and weekly plan submission receives a completeness score based on whether fields, photos, resource allocations, and locations are filled in. Scores roll up into a heatmap by team member and trade, so project leaders can coach individual supervisors instead of sending blanket reminders. Stale or unupdated issues are flagged automatically.
Out-of-the-box dashboards cover record completeness, daily reporting compliance, issue volume by trade and location, downtime hours, plan-versus-actual variance, resource utilization, and change event frequency. Custom dashboards let teams add project-specific KPIs such as safety observations, quality non-conformances, or productivity ratios for specific trades.
Yes. Professional Plus plans include portfolio reporting, which aggregates KPIs across every project in your account. Regional directors and senior leadership can compare delivery performance, claim recovery, and record quality across schemes, and identify which project teams need support. Drill-down lets them get from portfolio view to a single issue in two clicks.
Yes. Heatmaps by user, trade, and contractor show who is logging quality records and who is not, with completeness percentages, late-update flags, and reporting gaps. This is intentionally a coaching tool: contractors using Shape have reported 90% higher tool adoption than complex legacy software, because issues are addressed person-by-person rather than by blanket policy.
Data Book can export structured data to XLSX, CSV, and directly into Power BI and Power Automate workflows. Many contractors mirror their Shape data into a Microsoft Fabric or Snowflake warehouse for advanced analytics, while keeping Shape as the system of record. Standard integrations include SharePoint, Procore, Autodesk Construction Cloud, Asite, ProjectWise, Viewpoint, and Aconex.
No. Data Book works with schedules from Primavera P6, Asta Powerproject, MS Project, or any XML import. The analytics layer is schedule-agnostic, focusing on how site activity rolls up against whatever schedule structure the contractor uses. This is why Data Book works equally well for civils, MEP, infrastructure, fit-out, and energy projects.
Yes. The Professional plan includes a top-down record quality view, delivery performance analytics, issues and shift report heatmaps, and full adoption support. Custom dashboards, advanced analytics, and portfolio-level insights are unlocked on Professional Plus, both on annual billing.
Data Book surfaces emerging risks by tracking the leading indicators that precede schedule slippage: rising issue counts in a specific area, declining record quality from a trade, recurring downtime reasons, and growing plan-versus-actual gaps. Combined with Change Tracker alerts, this is how Shape customers identify up to 80% of project risks before they impact the critical path.
Shape Data Book is used by general contractors including Balfour Beatty, Kier, Technip Energies, Danaher & Walsh, and Sweet Projects, alongside specialist subcontractors including Emico, Bysteel, and Jones Engineering. Customer projects range from data centers and tech facilities to defense, infrastructure, oil & gas, and commercial fit-out, on schemes from £1 million to multi-billion-pound schedules.


