SHAPE FOR DELAY AND DISRUPTION CLAIMS

Prove what delay and disruption cost you

Stop reconstructing events after the fact. Get contemporaneous evidence of every delay and disruption on site, linked to schedule activities it affected and ready for a claim.
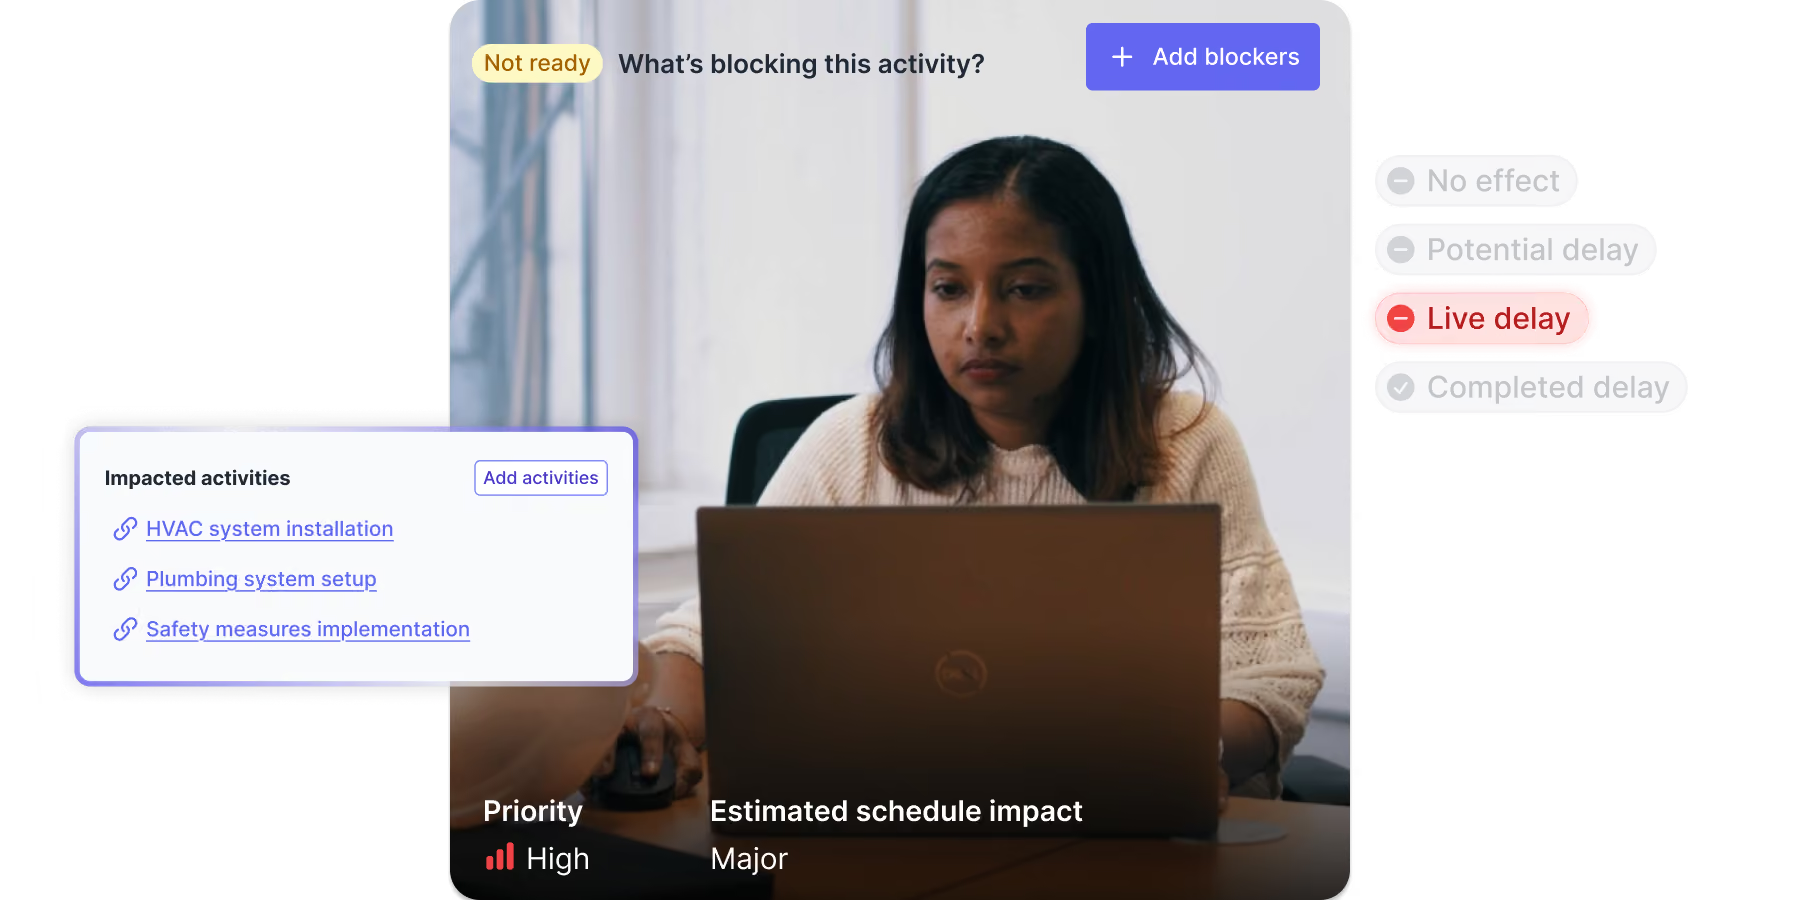
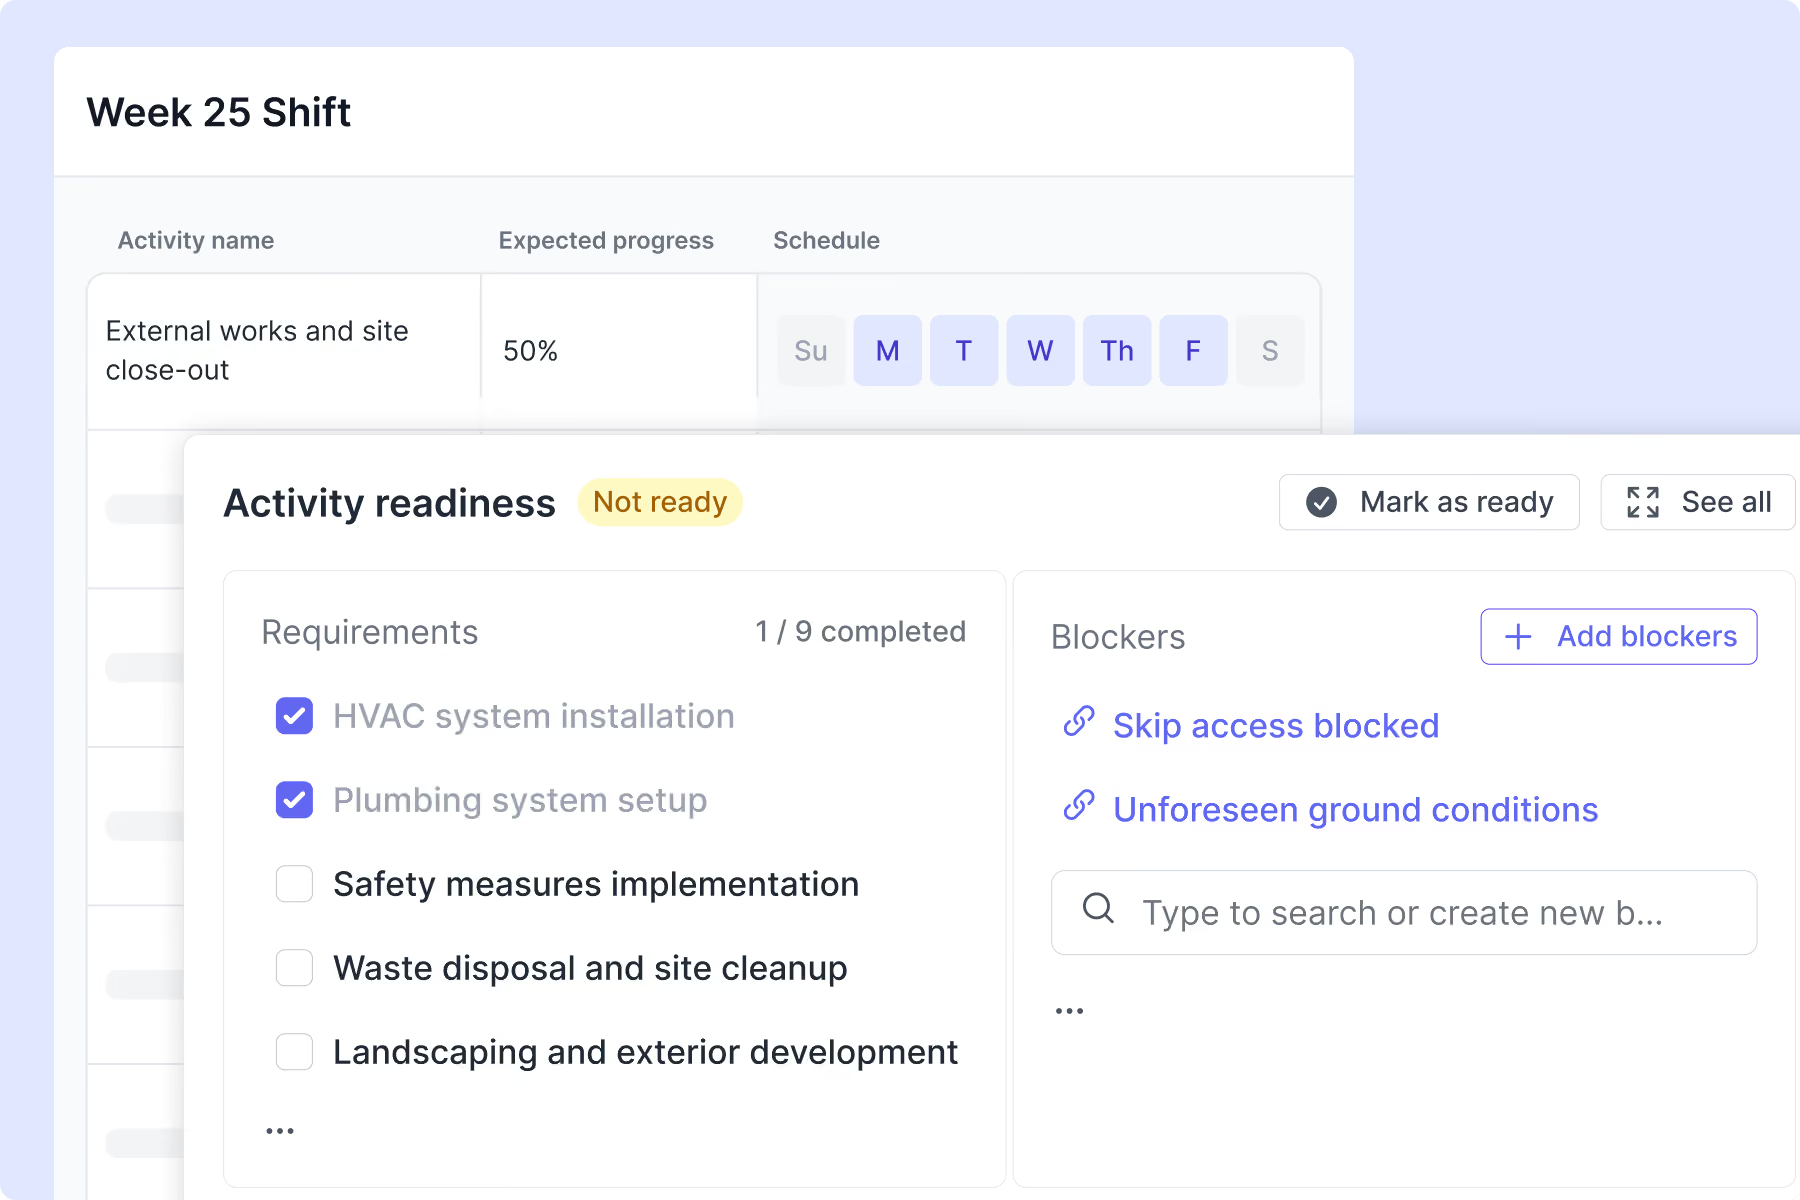
A woman focused on her laptop at a desk with a project management screen overlay showing a 'Not ready' status, question 'What's blocking this activity?', and a button labeled 'Add blockers.' The screen also lists delay types including No effect, Potential delay, Live delay (highlighted in red), and Completed delay. A box shows impacted activities: HVAC system installation, Plumbing system setup, and Safety measures implementation, with options to add activities. Priority is marked High and estimated schedule impact is Major.

LEADING CONTRACTORS USE SHAPE TO RECORD DELAY AND DISRUPTION AS THEY HAPPEN

THE PROBLEM IS...

You're absorbing delay and disruption costs that aren't yours

You never hear about half of it

The stoppage that shuts the site down reaches you. Two hours lost waiting for access doesn't. The small events add up, and they're the ones that stay on site.

Piecing it together takes days

When you do find out, the story is spread across messages, emails, and thin daily reports. Reconstructing what happened after the fact eats up your team’s time.

A messy, cluttered desk covered with stacks of papers and old records, labeled 'Low Coverage - High Quality.'

The evidence is too weak to prove impact

Vague notes and missing timestamps don’t hold up. You can’t show who was responsible or quantify the hit to time and cost.

1

Capture the full history of every delay and disruption

Skip the forms. Capture records from site chats.

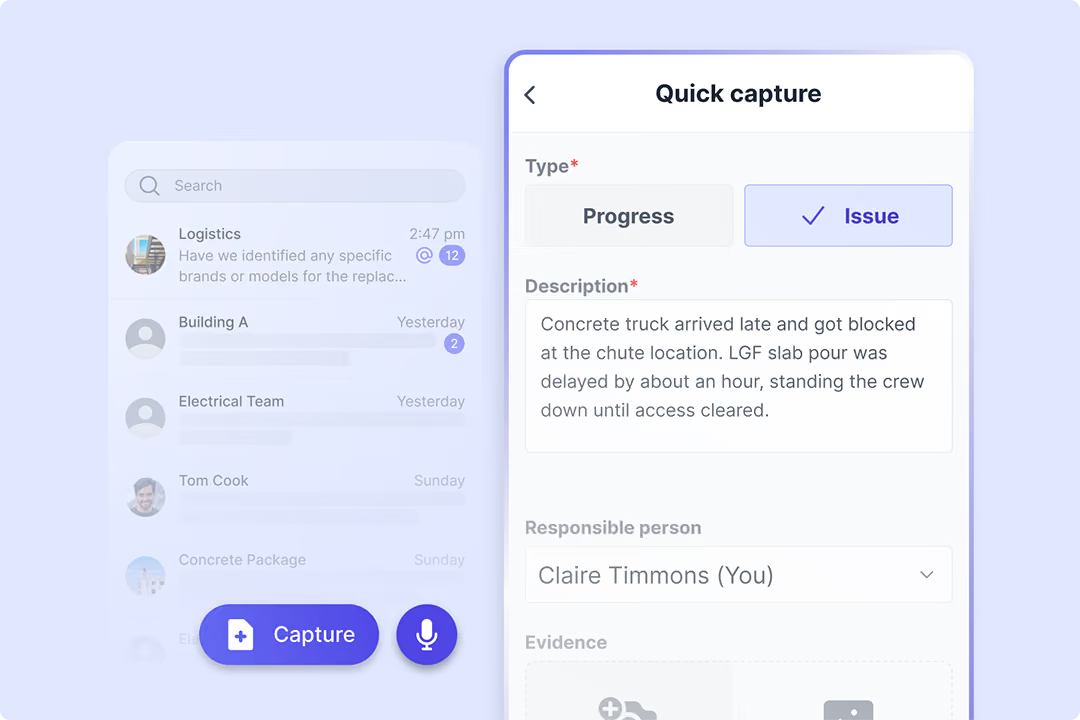
When work stops or slows down, site teams raise it as an issue through a simple messaging app. The conversation and photos stay with that issue as the situation develops, so what you end up with is the whole story rather than a single entry.

Construction site with a large blue drilling rig and workers, under a cloudy sky.

See who's logging quality records and who isn't

Each record gets a completeness score based on the detail it holds. See who's capturing properly and who isn't, and fix it while the work is still going on rather than when a claim depends on it.

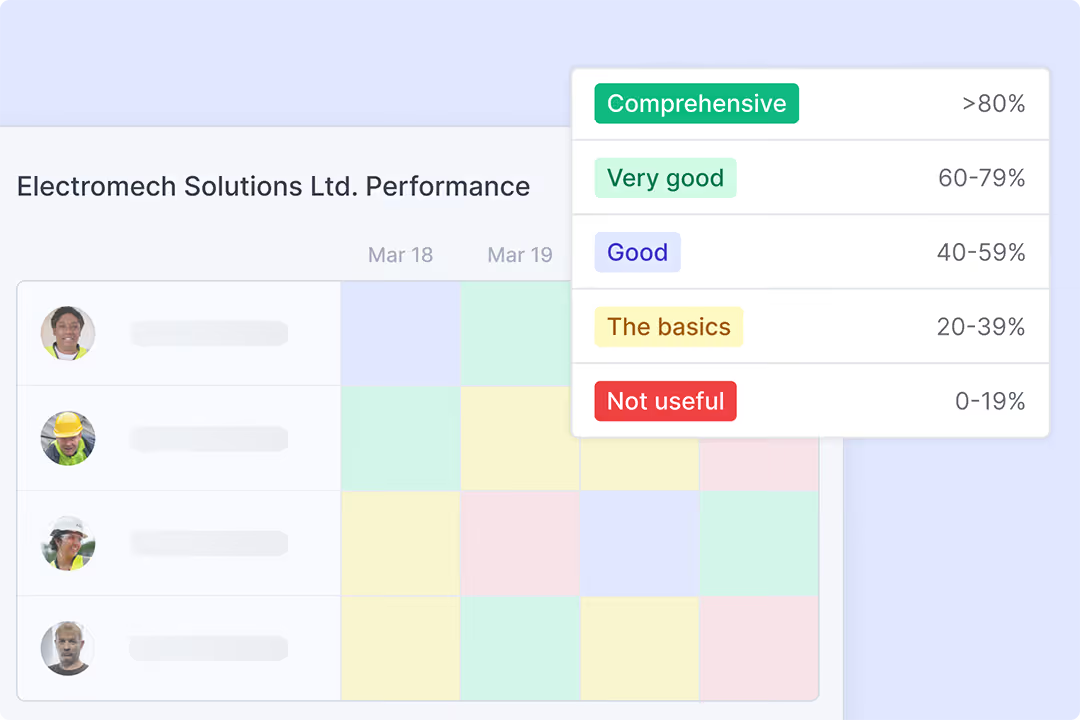
Performance table of Electromech Solutions Ltd. showing employee photos on the left and color-coded performance ratings for March 18 and 19, with a legend indicating rating categories from Not useful (0-19%) to Comprehensive (>80%).
2

Get notified when delay and disruption happen

Get the hours lost, not just that work stopped

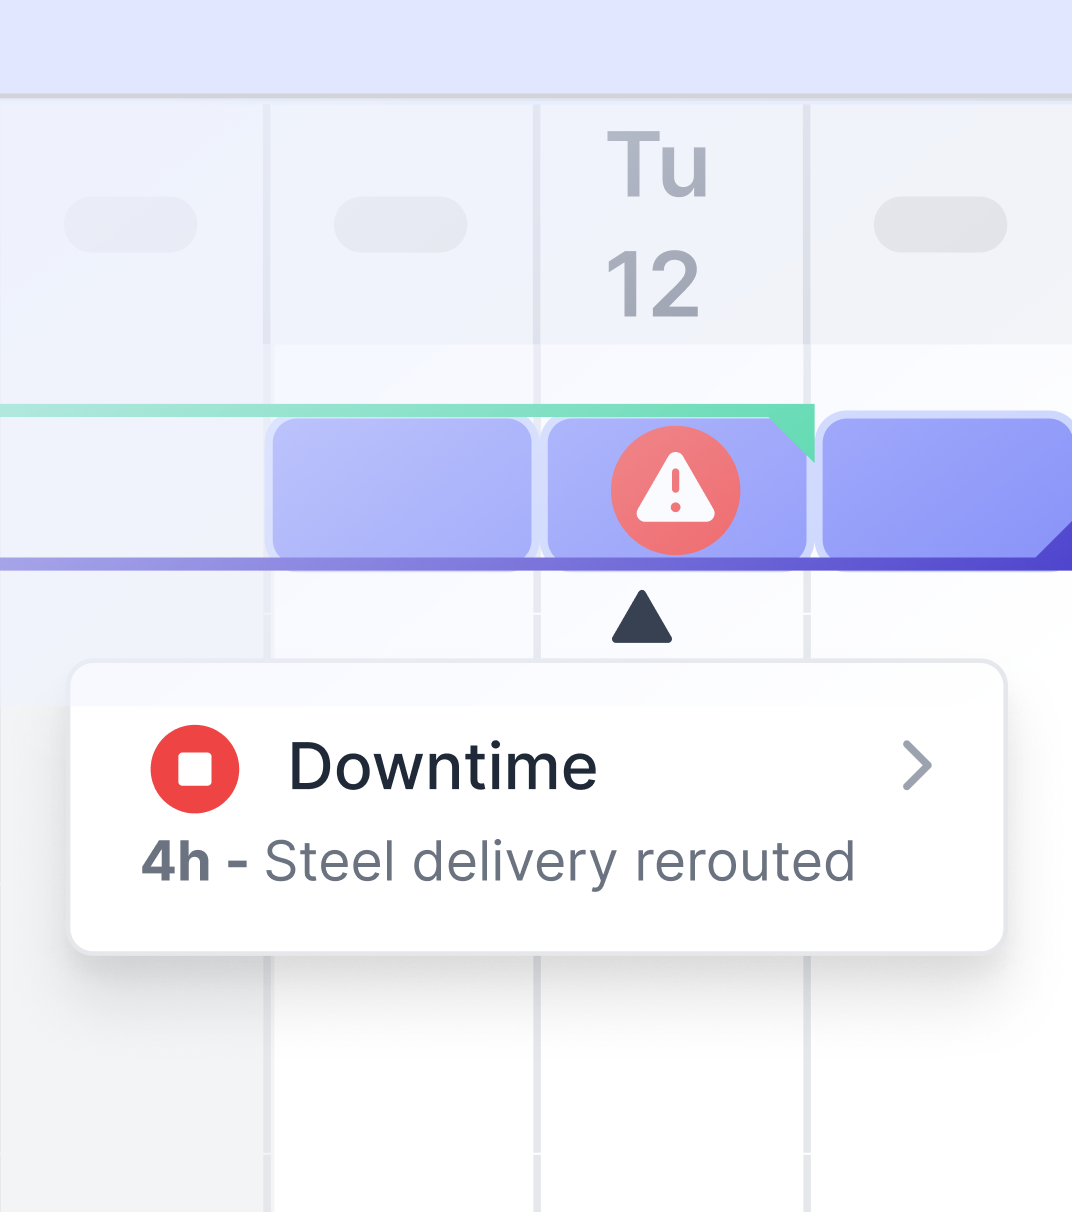
When an issue stops work, it feeds into the downtime in that day's report to capture hours lost and the schedule activity held up. Every alert comes with that detail attached, so you know how much time it cost.

Screenshot of a Downtime & Delay report showing an issue with a corroded pipe section causing an active water leak, 50 hours lost due to unexpected utility leak, with a photo attachment of the corroded pipe.

See the full context behind every flagged issue

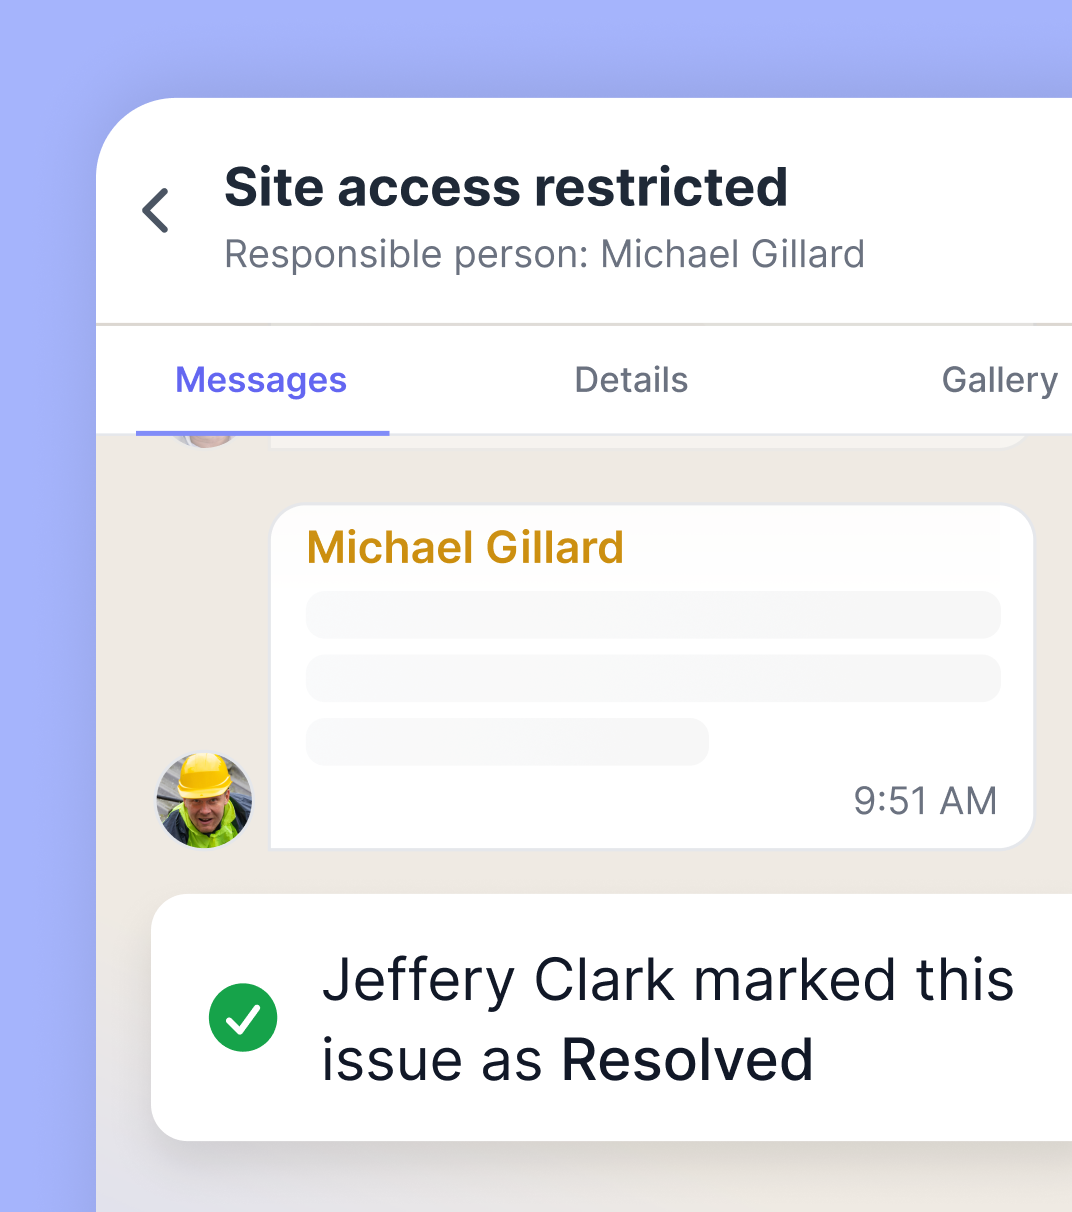
Every issue comes with the cause, the location, who's responsible, the photos, and the discussion through to resolution. Site teams mark whether it's causing delay and update it as the situation moves, so you always see where it stands.

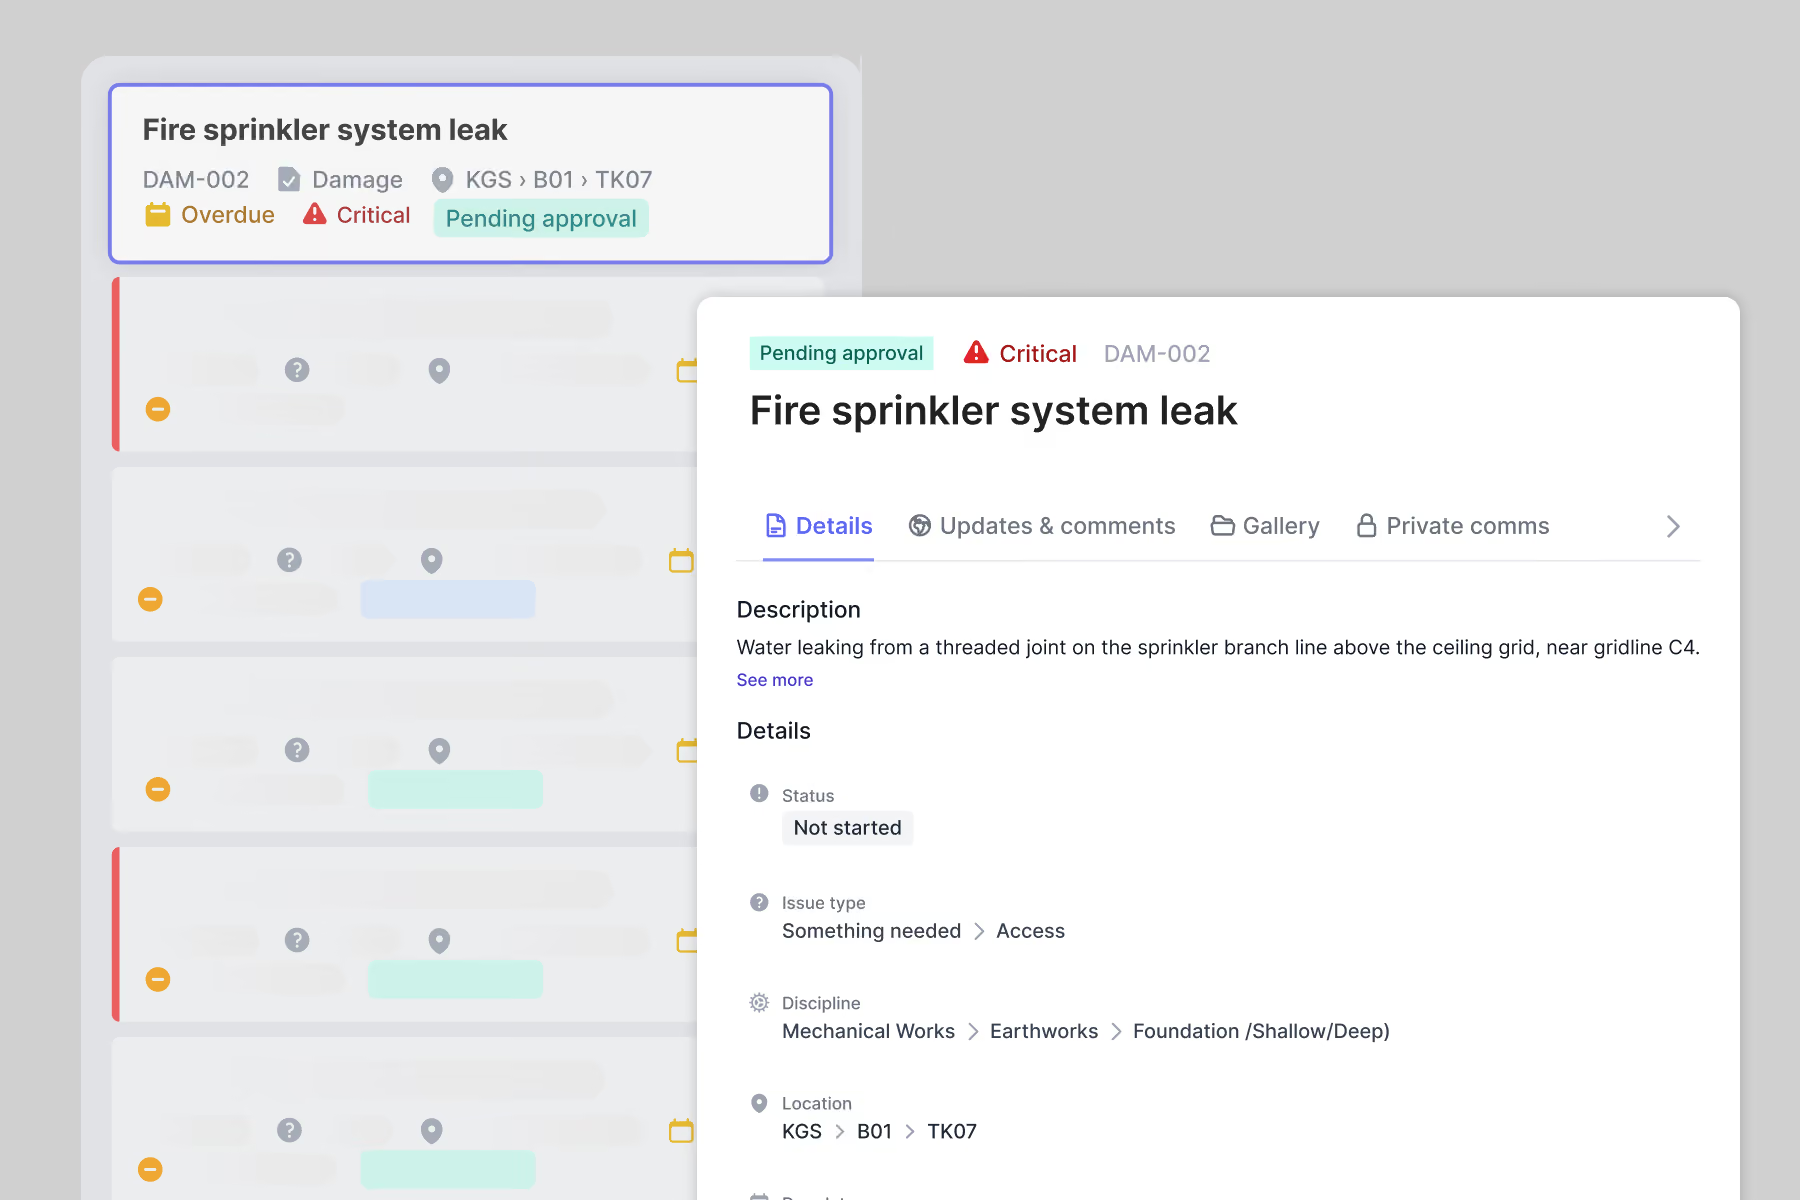
User interface screen showing a fire sprinkler system leak claim labeled DAM-002, marked overdue, critical, and pending approval with comment updates including a photo of a leaking sprinkler pipe in a concrete corner.

Know when something on site is going to cost you

Time lost, productivity lost, and work outside the contract all trigger alerts automatically. Review them in one place: pursue what matters, dismiss what doesn't, and build the rest into the evidence for a claim.

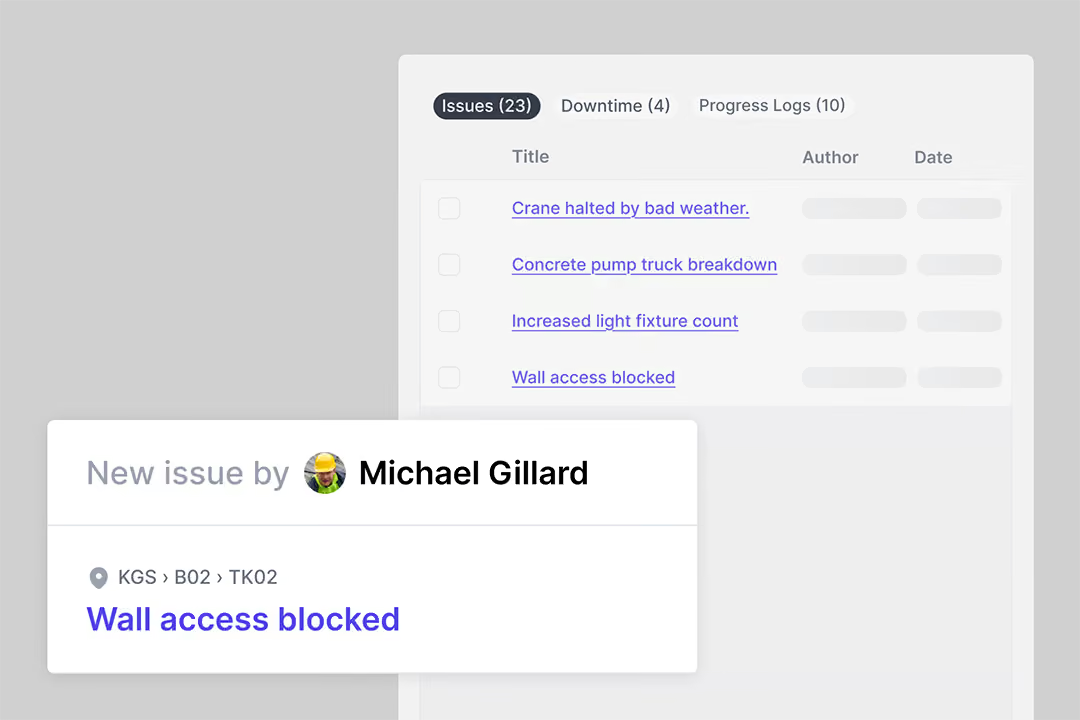
Dashboard showing a list of issues, downtime, and variances including 'Wall access blocked' reported by Michael Gillard.
3

Prove the impact on time and cost

Quantify the cost impact

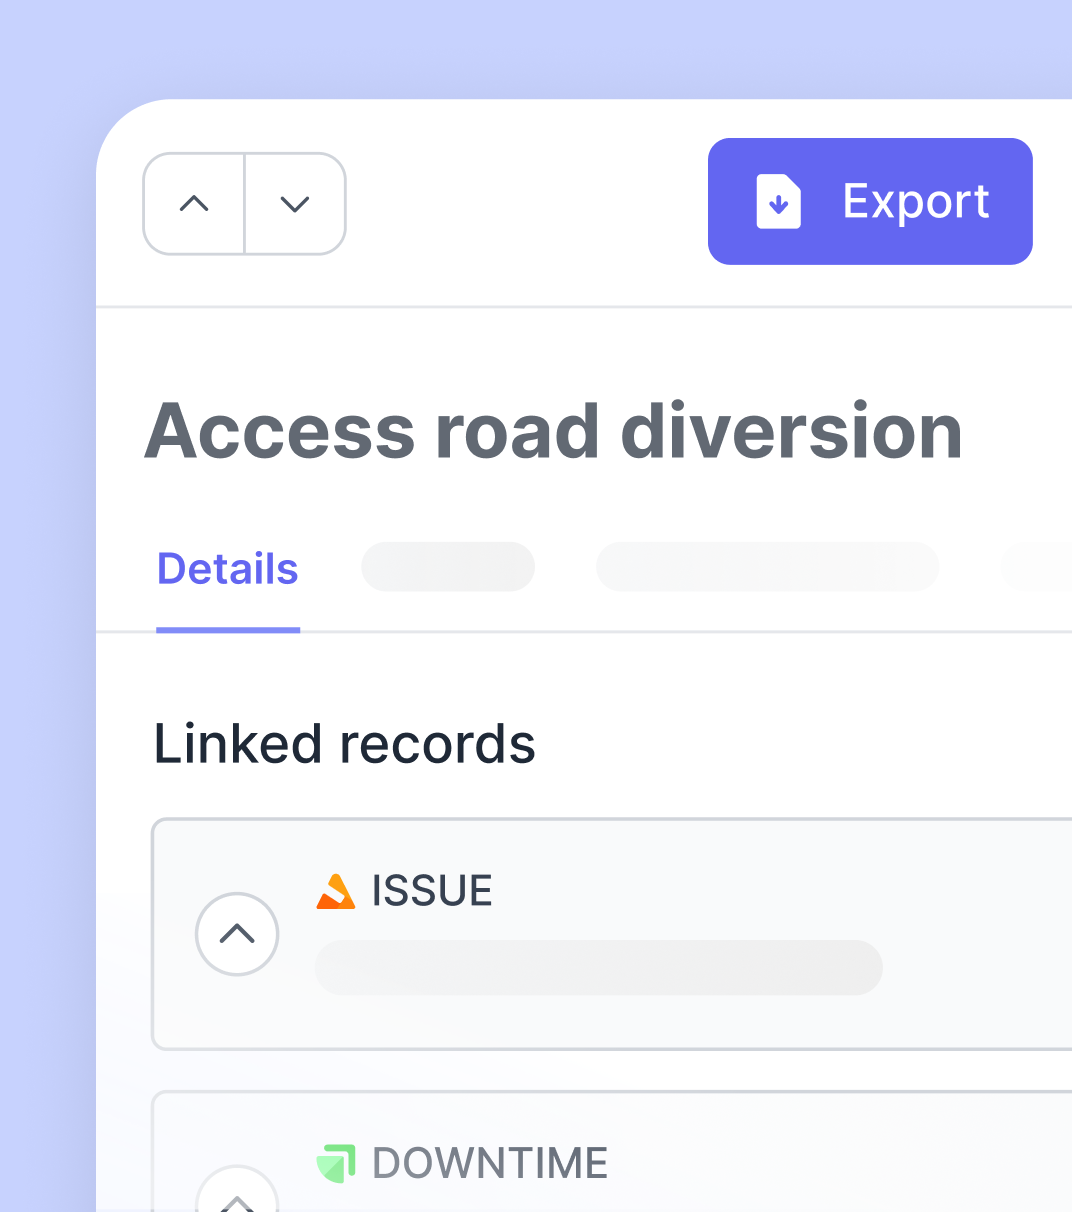
Import your schedule and connect the issues and downtime from site to the activities they affected. See when work stopped, for how long, and what was happening at the time, with the audit trail to back it up.

Table showing 54 total entries with columns for Title, Linked Signals, Cost Impact, and Schedule Impact, listing items with minor to major cost and schedule impacts.

See where the delay hit your schedule

See the hours and equipment affected across every day the issue ran, by activity. Export it to a spreadsheet to work out the cost and substantiate the financial impact.

Overlapping project report screens showing a Change Report titled 'Change in window supplier', a Linked Issue 'EQP-0004- Rough openings do not meet specifications', and a Shift Report 'Piling Site Diary - Zone 4' with project and shift details.

Export a record ready to submit

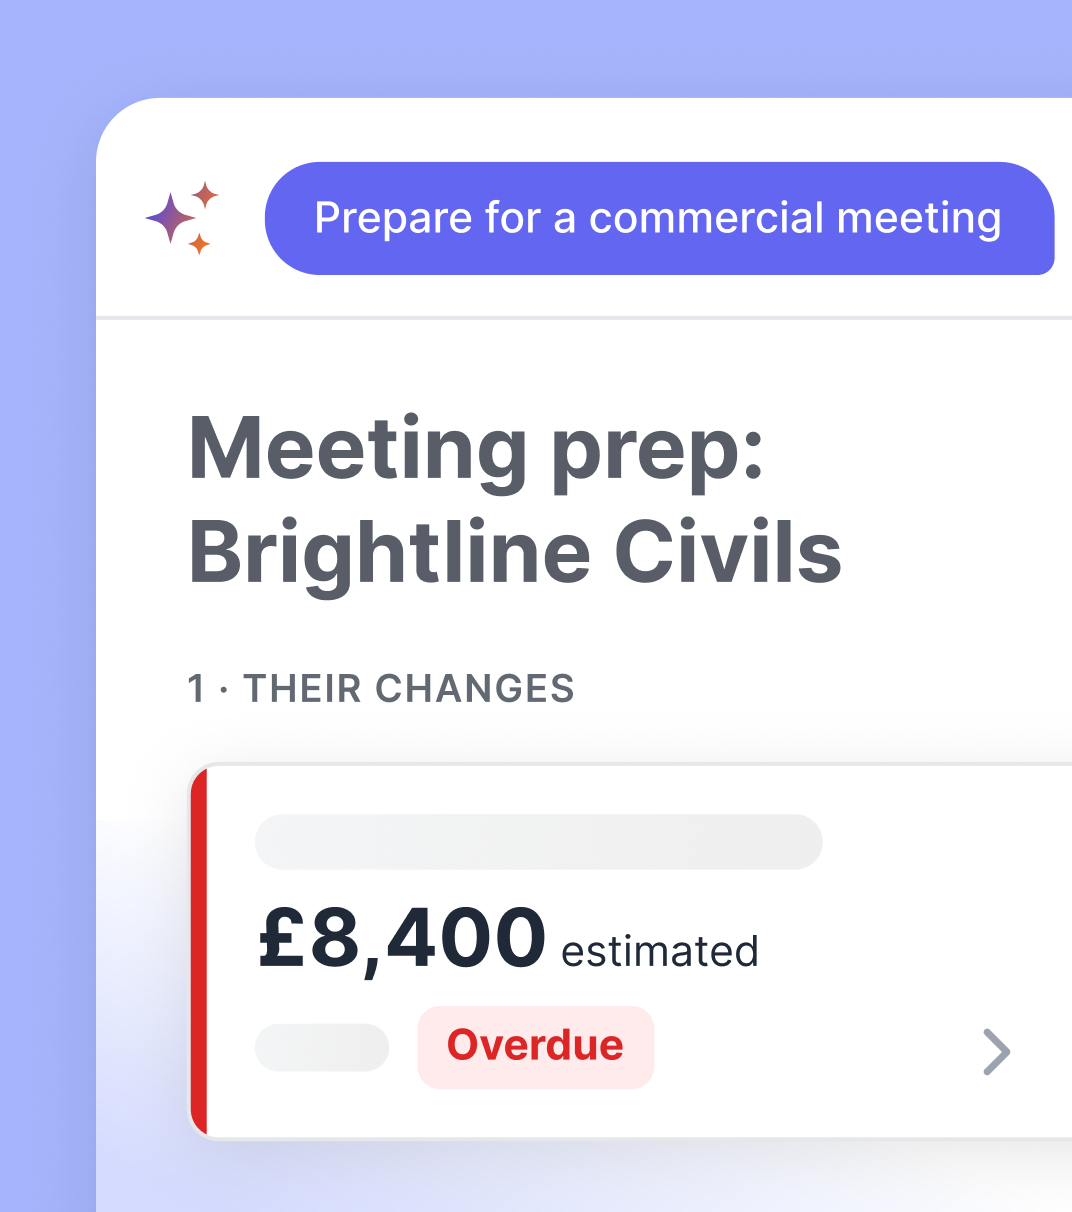
Pull everything tied to an event into one structured report, ready to support a delay notice, an extension of time, or a disruption claim.

Stop losing out on delay and disruption you can’t prove

See how leading contractors capture delay and disruption as it happens and prove the impact on time and cost.

“A lot of the time, the way that you build the project, there's a lot of change involved. Shape allows you to track all of those changes. You can see the journey that Shape created for you by all of the updates that you do through there.”
Dan Van Wyk profile photo

Dan van Wyk

Project Manager, Sweet Projects
"Shape was quickly adopted by our team due to its user-friendly interface. We no longer waste time on manual paperwork or lengthy email chains, trying to resolve coordination or blocker issues.​"
Sunny Hundal profile photo

Sunny Hundal

Mechanical Package Manager, Emico Ltd.
"Shape provided a clear, simple, and accessible database for tracking project issues, giving us better visibility into programme impacts, delays, and improving contract management.​"
Andre Costa profile photo

Andre Costa

Operations Director, Bysteel

Frequently Asked Questions

How does Shape make sure delay and disruption events actually get recorded?
How is this different from tracking issues in a spreadsheet or our current site software?
Will the field team actually capture this in the moment?
We already keep daily reports. Why isn't that enough?
What do I actually get when it's time to make a claim?
Do we have to replace our existing systems?